Occupancy, shrinkage, and the arithmetic behind contact center staffing
Contact center staffing goes wrong in a predictable way: someone calculates how many agents are needed to answer the forecast volume, rosters exactly that many, and then spends the quarter wondering why service levels miss. The calculation was not wrong. It was answering a different question.
Two different numbers
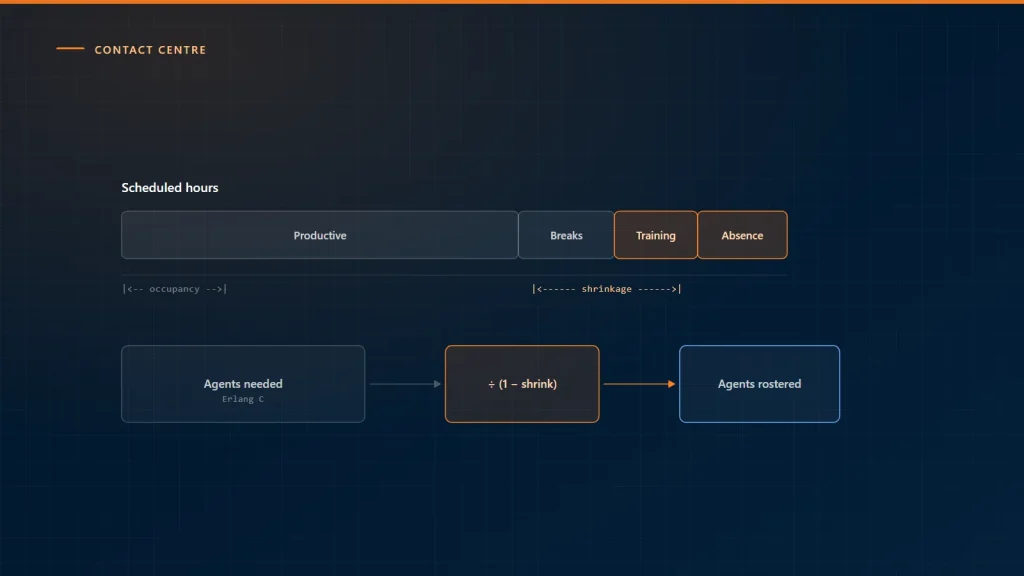
There is the number of agents who must be on the phone to hold a service level, and there is the number of agents who must be on the payroll to produce that. The gap between them is shrinkage, and in most centers it is between a quarter and a third of paid time.
Working out who must be on the phone
This is an Erlang C calculation, and it takes three inputs: contacts per interval, average handle time, and the service level you want to hold. It returns the number of agents that must be available.
Two things about it surprise people the first time:
- It is not linear. Doubling the volume does not double the agents. Larger queues are more efficient, which is the whole argument for consolidating small ones.
- The last few points of service level are the expensive ones. Going from 70% to 80% answered in twenty seconds costs far less than going from 85% to 95%. That curve is worth showing to whoever sets the target.
Shrinkage is everything that is not the queue
Shrinkage is paid time during which an agent cannot take a contact. It is not waste — most of it is necessary — but it has to be counted.
- Planned: breaks, lunch, training, coaching, team meetings, annual leave.
- Unplanned: sickness, lateness, system outages, attrition gaps between a leaver and a starter.
Measure it from your own rota and payroll rather than adopting a benchmark. Two centers of the same size routinely differ by ten points, and the difference is usually training load and leave policy rather than anything about the work.
Putting the two together
The rostered requirement is the on-phone requirement divided by the proportion of time that is productive. If Erlang says you need 30 agents available and your shrinkage is 30%, you need 30 ÷ 0.70 — about 43 rostered. Rostering 30 is the error, and it is an error of 43%, not of 30%, which is why the miss feels so much larger than the assumption behind it.
Occupancy is a constraint, not a target
Occupancy is the share of available time an agent spends actually handling contacts. It is tempting to drive it up, because idle time looks like waste on a report. It is not waste; it is the buffer that absorbs variance.
Sustained occupancy above the mid-eighties tends to show up as attrition, sickness and longer handle times within a quarter — all of which increase shrinkage, which increases the rostered requirement. It is one of the few operational metrics that will actively punish you for optimizing it.
Intervals, not days
Staffing to a daily total hides the shape of the day. A center that is correctly staffed on average can be badly short at ten in the morning and badly over at three in the afternoon. Forecast and roster in half-hour intervals; the arithmetic is the same, it just gets applied more times.
A practical sequence
- Pull twelve months of interval-level volume and handle time from the platform you already run.
- Measure shrinkage from your own rota — planned and unplanned separately, so you can act on them separately.
- Run Erlang per interval for the service level you have actually committed to.
- Divide by productive proportion to get the rostered requirement.
- Compare against the roster you have, and look at where the gaps sit in the day rather than in the total.
Every input in that list is something a contact center platform already records. Our call center solutions expose interval-level volume, handle time and agent state as data you can export rather than only as dashboards, which is what makes the calculation repeatable rather than an annual exercise.